
California has set some of the most ambitious climate goals in the world, but much of the work of meeting them falls to its cities. Local governments are expected to measure their emissions, set targets, and track progress, often without the staff, data, or budget to do any of it well. A single greenhouse gas inventory, the basic accounting of where a city’s emissions come from, can cost up to $100,000 in consultant fees. As a result, many cities update their numbers only once every five or ten years, when the money and staff time allow.
ClimatePlans.org was built to change that. Led by Dr. Chris Jones, Director of the CoolClimate Network at CIEE, the platform provides the first comprehensive, sector-by-sector inventory of every city in California. Its purpose is practical: “Our primary goal is to save local governments time and money,” Jones says.
Seeing What Cities Couldn’t
What sets ClimatePlans apart is the depth of its data. It draws on utility records reaching back to 2005 and smartphone mobility data that models how people actually travel. It also tracks EV adoption and charger growth neighborhood by neighborhood, and keeps a record of every grid-connected solar array in the state going back to 1988. That depth can change what a city knows about itself — they can quickly understand how well they are doing compared to peers, helping to prioritize their next policies and programs.
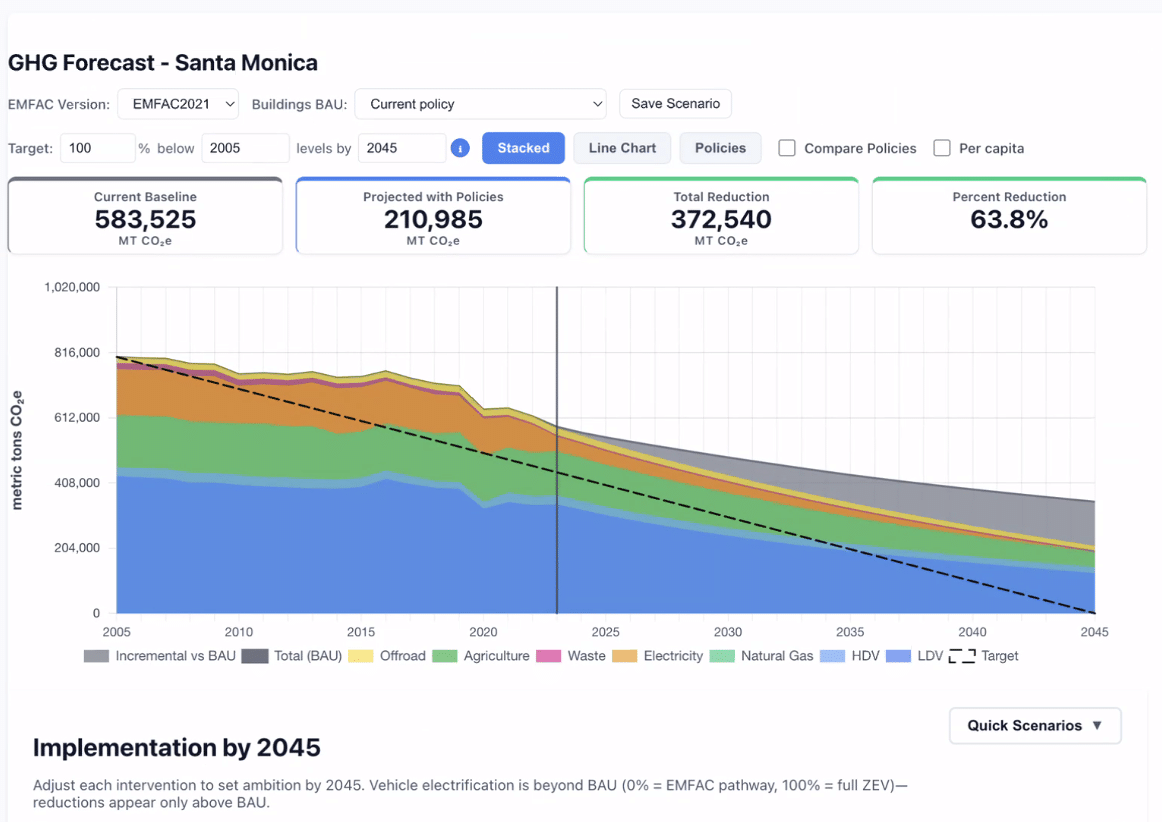
The platform also helps cities look ahead: planners can model how current and proposed policies will shift emissions through 2045, and test what it would take to close the gap. Alongside those projections, ClimatePlans tracks who bears the costs of the transition and who shares the benefits, showing disparities by race, income, education, and wages. As Jones puts it, “It’s important to track these factors alongside our climate goals.”
From One-Off Reports to Shared Progress
Membership comes in two levels, affiliate and regular, with pricing scaled to a city’s population, at a fraction of the cost of a single consultant-led inventory. Regular members gain planning tools, a customized data portal, progress scores, and behavior-change programs. San Francisco is running one of those programs this October, a month-long challenge in which city employees compete with coworkers to complete small climate actions.
For Jones, the bigger shift is in how the work gets done. “It’s mostly consultants doing this work right now,” he explains. “We want to spread knowledge across the entire state and learn lessons collaboratively.” Because every member works from the same platform, an improvement made for one city reaches all of them at once, or in his words, “Anything we do for one member, we do simultaneously for all of our members.”
Looking Forward
New cities are signing on now, and the research behind the platform is moving through academic review. Papers on the project’s waste and transportation models have been submitted for peer review, with an energy paper to follow soon. For the team, the launch is the start of a longer partnership: “We’re really looking forward to working with cities, learning with them, and serving our members,” Jones says.